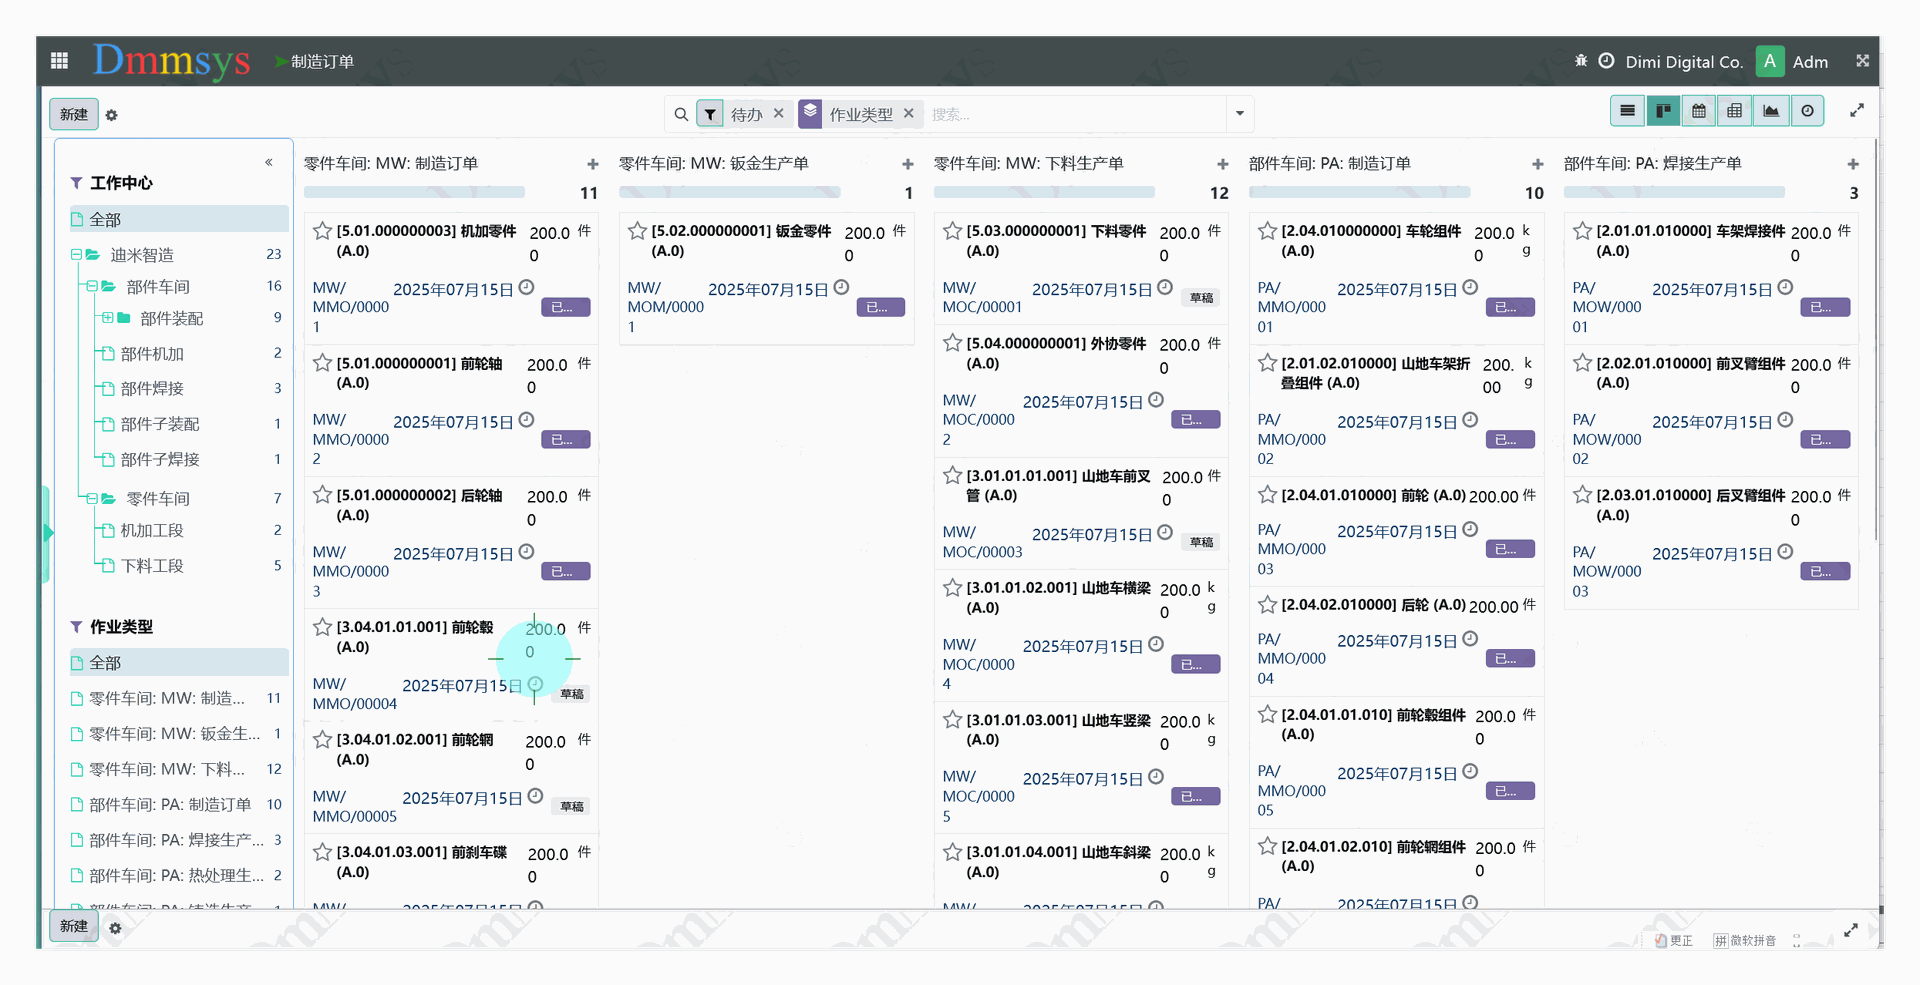
Quality Indicator Monitoring
Real-time calculate yield, first pass yield, defect rate and other key quality indicators.
Analyze quality trends by product, operation, and time period.
Contact Us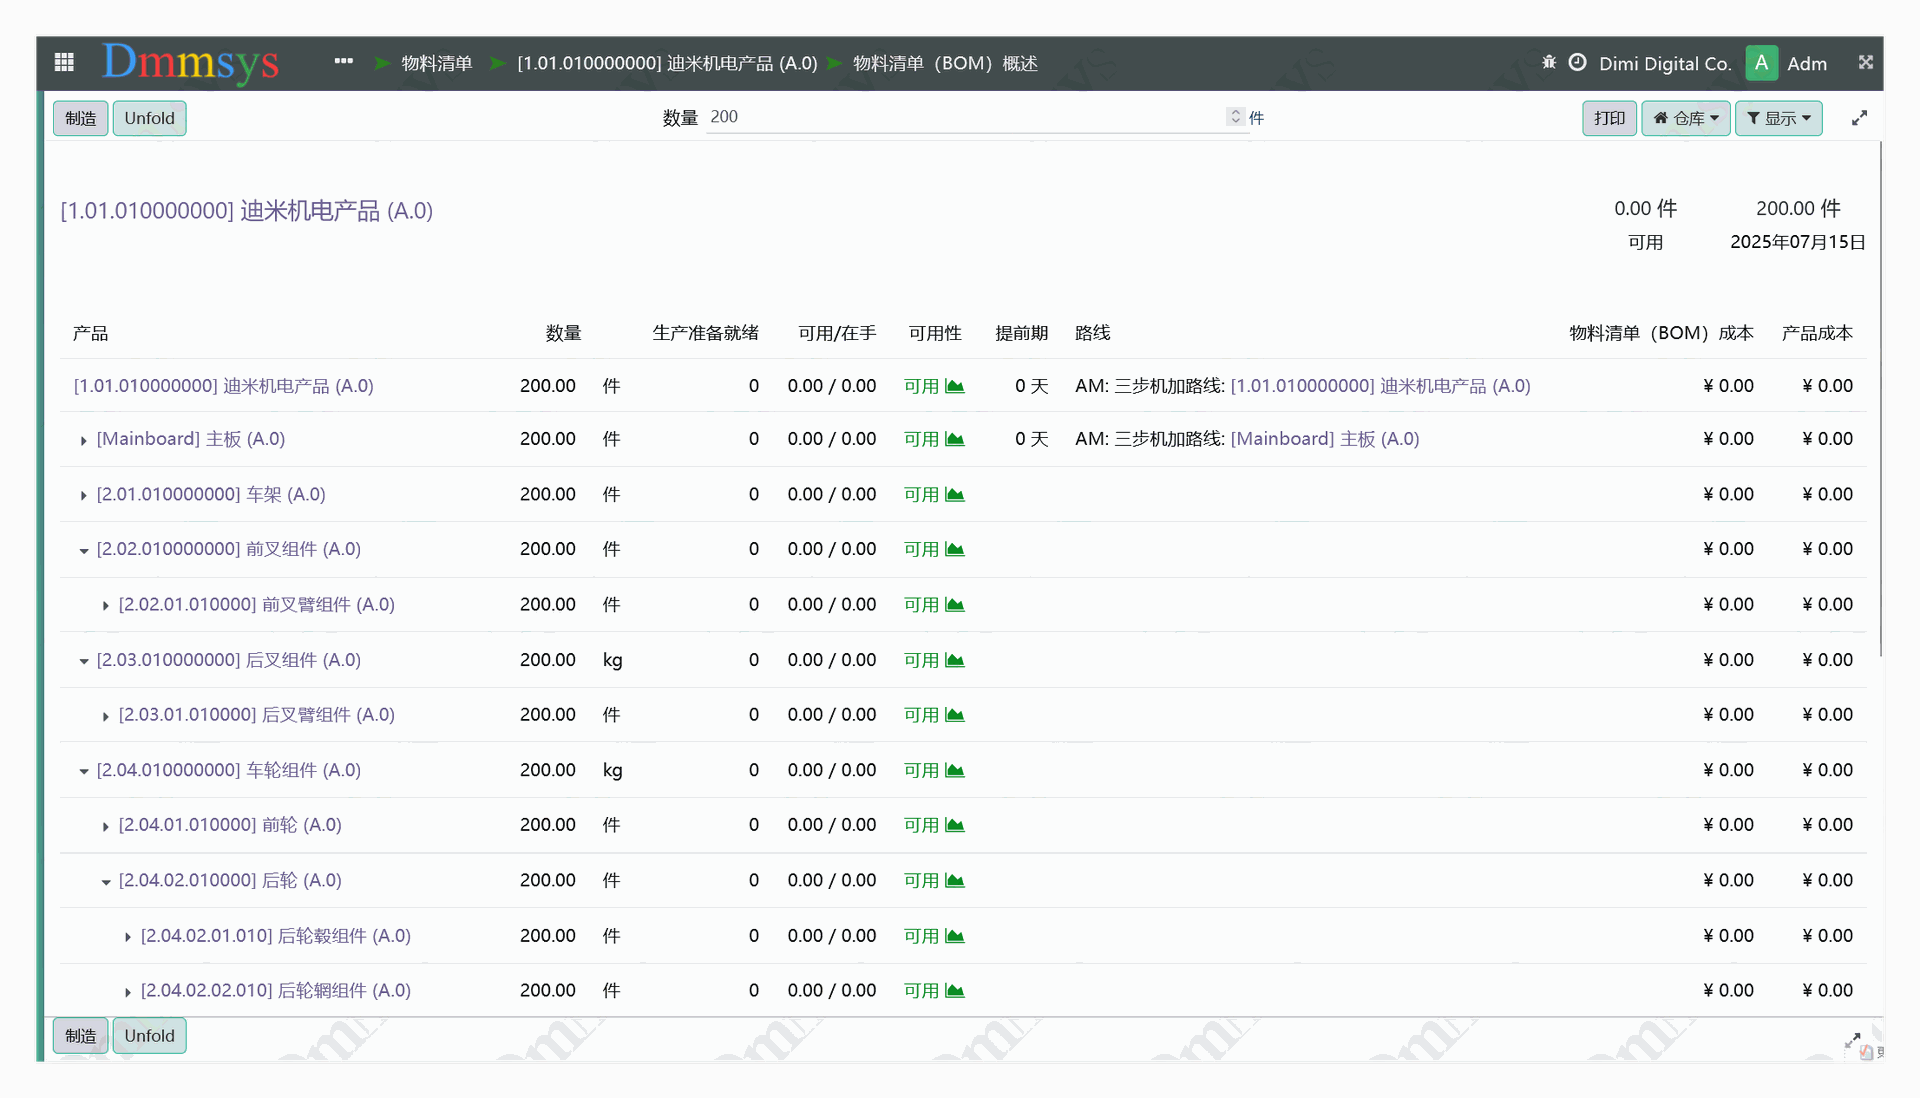
SPC Control Chart Analysis
Use X-bar R chart, P chart and other SPC tools to monitor process stability.
Auto-identify abnormal points and trends, trigger alert notifications
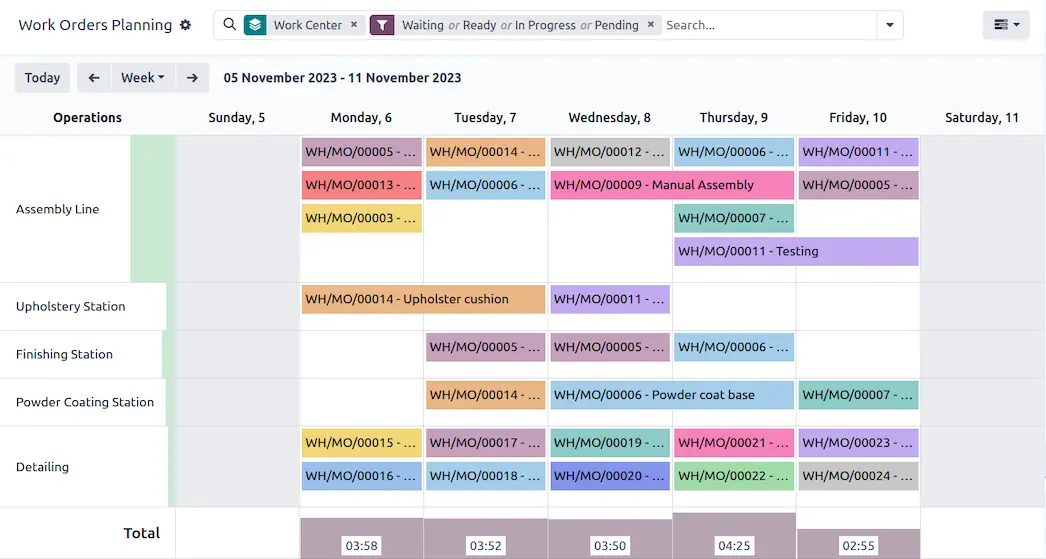
Quality Reports & Dashboards
Auto-generate daily, weekly and monthly reports, visualize quality performance.
Management digital dashboard for real-time factory-wide quality status.
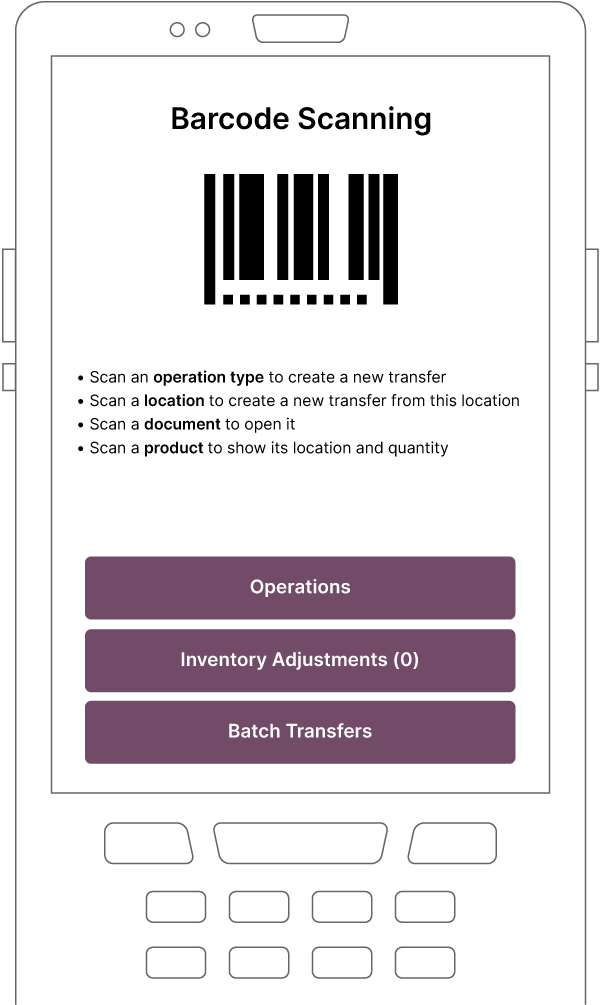
Quality Indicators Core Features

CRM

Indicators

SPC Charts
Reports

Dashboard
Odoo allowed our company to efficiently manage a growth from a turnover of $2.4m to $15m in 4 years.